The project begins by identifying, collecting, categorizing, and analyzing actual recordings of sound sources that constitute the dense sonic environments found in the Amazon Rainforest.
Each individual sound must be analyzed in order to synthetically recreate its unique harmonic structure – or timbre. Once the sounds are analyzed using Fourier Analysis, which identifies exact values for amplitude and frequency, they can then be reconstructed using additive synthesis.
Fourier Analysis is the method by which the sounds are deconstructed. Any complex sound, whether an insect, human voice, or waterfall, can be deconstructed and presented as a series of many (sometimes thousands) sinusoidal waveforms (the simplest of waveforms containing no overtones) – sometimes called partials or overtones. Each sinusoidal wave has a unique amplitude. Identifying the amplitude of each wave is the key to understanding the harmonic structure. Once the fundamental frequency (the frequency of the loudest, most present partial) is identified, the frequency of all other partials follow the harmonic series; that is, each subsequent harmonic will be an integer multiple of the fundamental frequency. However, it is the amplitude of these harmonic overtones that, when summed together, create the unique timbre of the sound.
The process of Fourier Analysis begins with several visual manifestations of the analysis process. These visual maps provide data visualization that allow for identification of the sound’s harmonic structure.
The first visual map created from this Fourier analysis is a sonogram. The sonogram is a representation of how energy is distributed in the harmonic spectrum, according to harmonic partials. It displays frequency vertically, time horizontally, and intensity (amplitude) as gradients of color or light.
In this example of a bird recording, the overtones can be seen as horizontal lines comprised of mostly white:
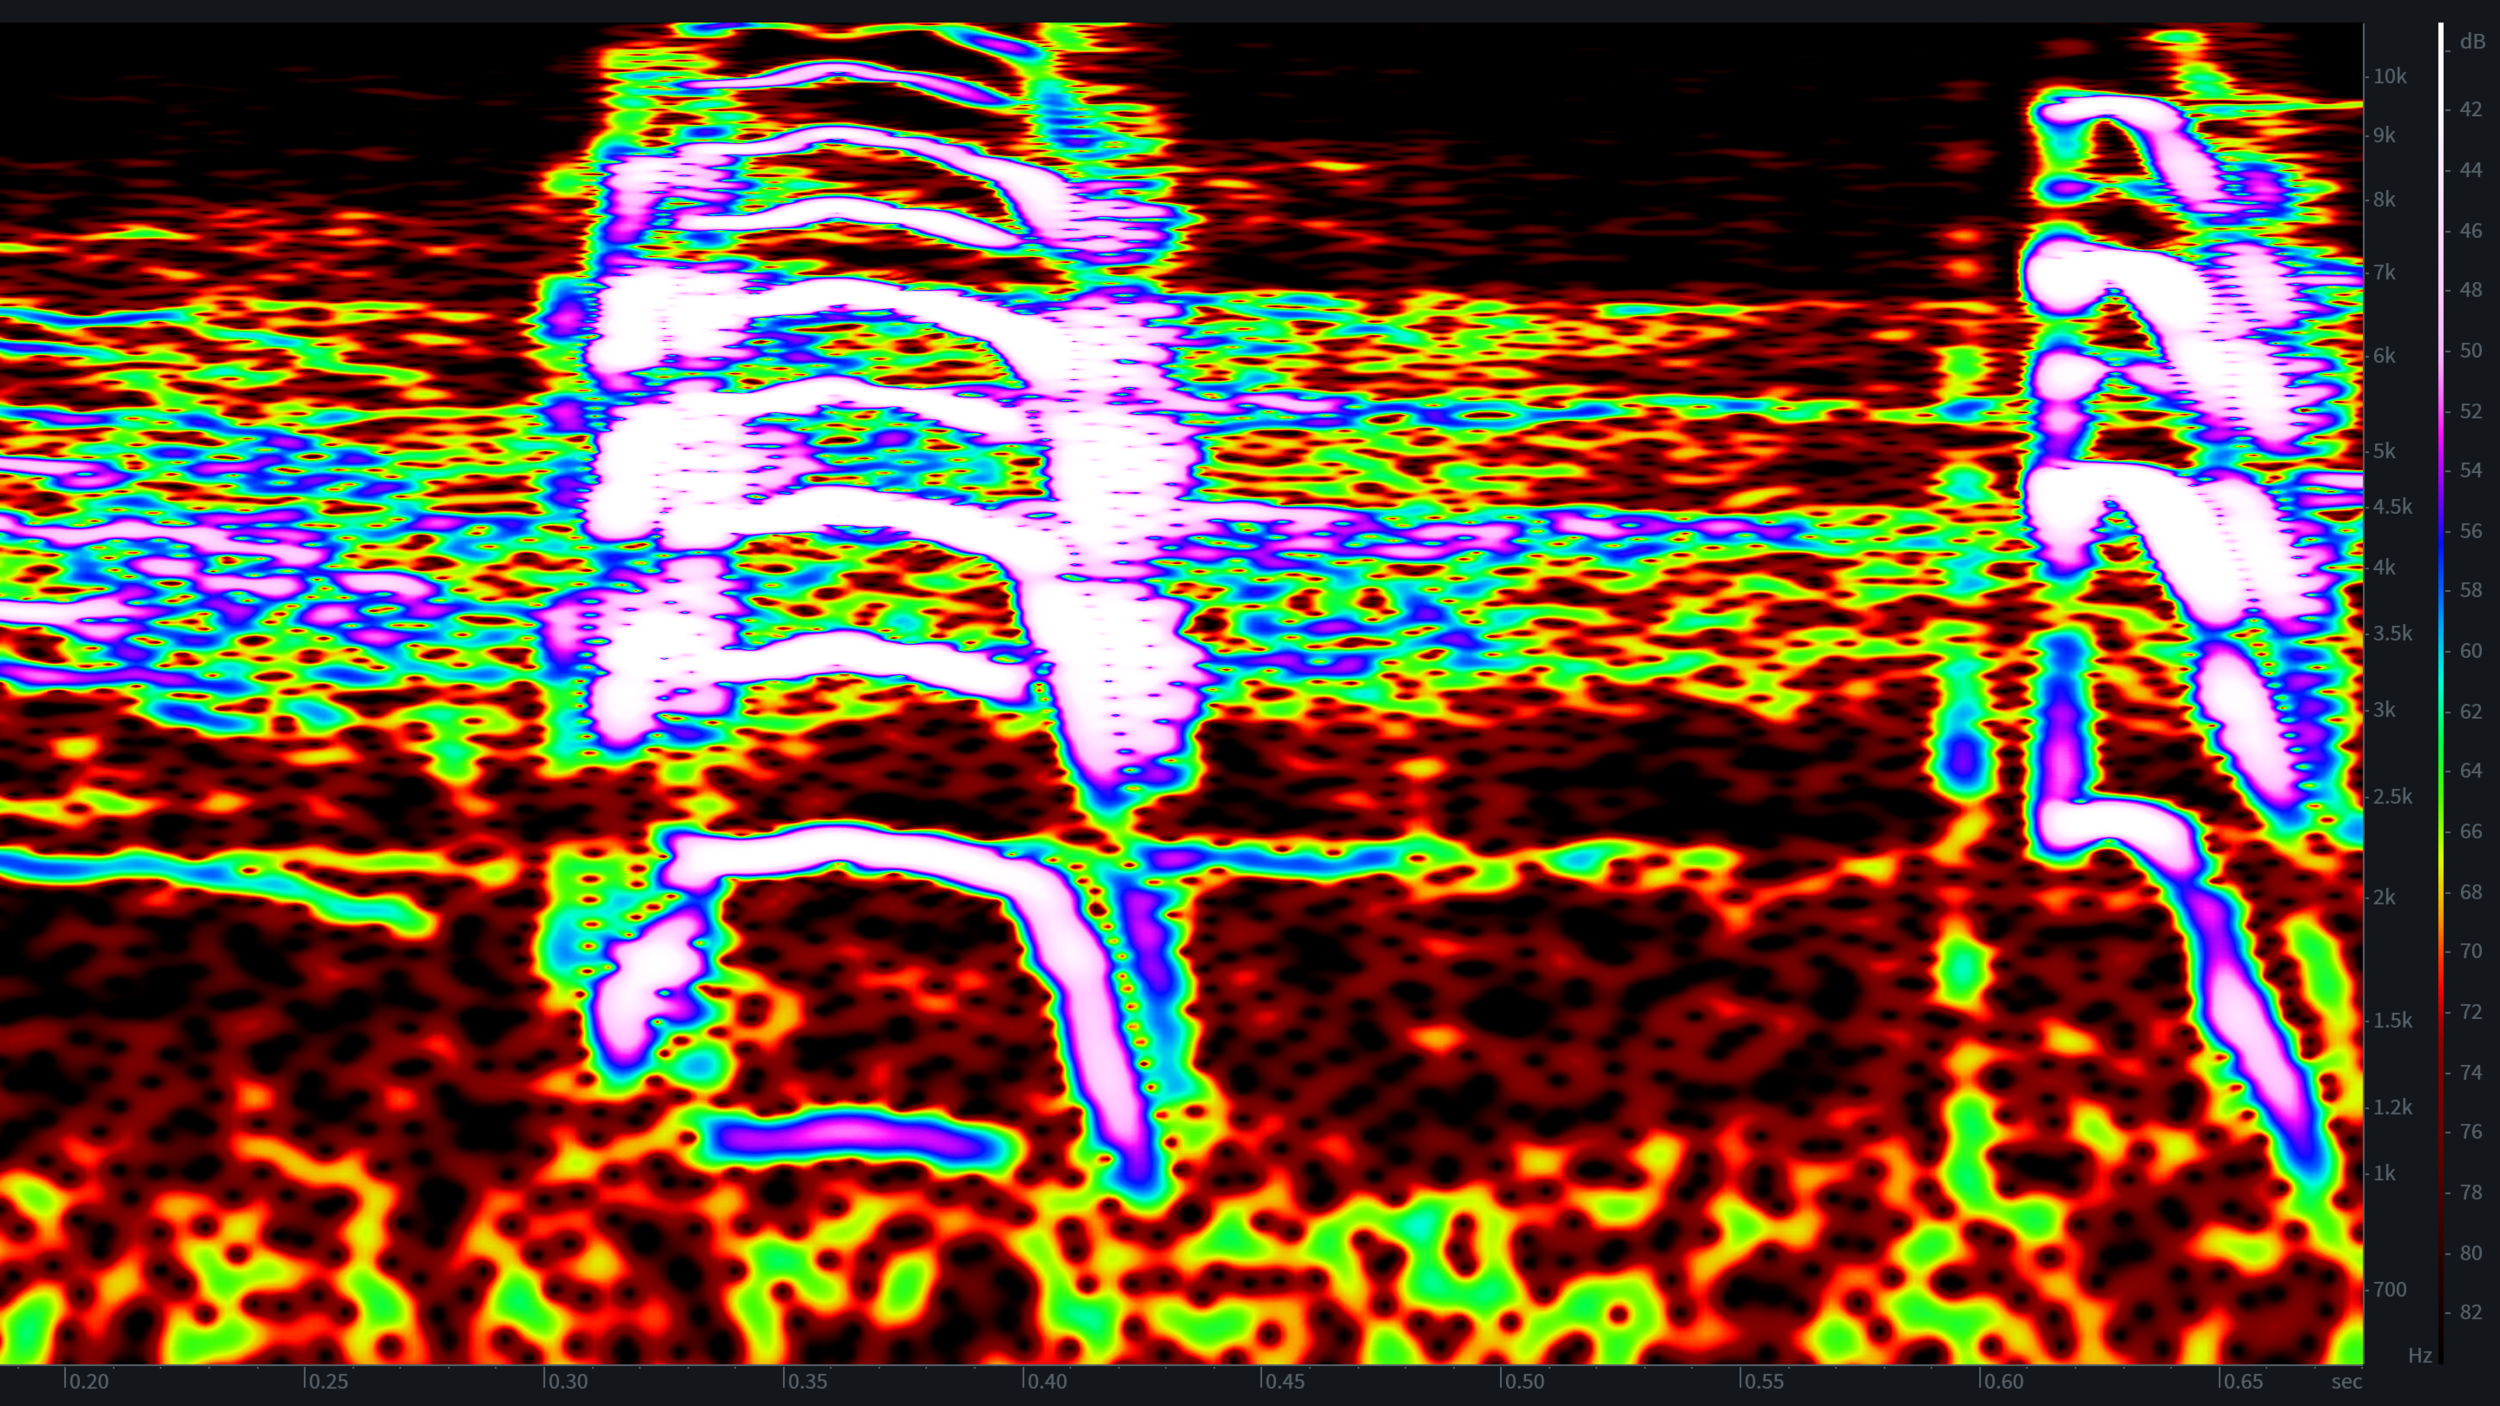
The sonogram shows how frequency and amplitude changes over time, but the data does not provide amplitude values precise enough to derive exact values.
In order to find the amplitude values of individual harmonic partials, a spectral analysis is derived from an instantaneous point of the sonogram. The spectral analysis displays exact values for amplitude and frequency. The important aspect of the spectral analysis to remember is that it does not show time. It is an instantaneous snapshot of a point in time.
Here is the spectral analysis of the same bird recording:

You can see the amplitude peaks that constitute the harmonic series: harmonics 1 through 10. The partials between these peak amplitudes are known as inharmonic partials and must also be considered when recreating the sounds.
Once each harmonic has been identified, the sound will be recreated using additive synthesis. Additive synthesis is simply a synthesis technique that creates timbre by adding sine waves together.
After the timbre has been recreated, the sound then needs to be sculpted to match the sonogram’s time-based characteristics.